What are QA Metrics?
What do you understand by QA Metrics? They simply help us to measure the quality and make sure we meet our quality guidelines. Measuring quality helps us to make the right decisions at right times and identify actionable trends. Metrics play an important role in tracking the progress and quality. There are different aspects of quality that can be measured through the QA metrics. One is the product quality. We can have an overall idea of where our products stands in terms of quality and what immediate measures we can take to improve the quality of a product. Another factor we can measure is the team efficiency. It helps identify where the team’s time and budget are being used ineffectively and optimize accordingly.
Metrics can be categorized as below.
-
Process Metrics: These can be used to improve the process efficiency of the Software Development Life Cycle, Testing process, etc.
-
Product Metrics: Product Metrics deal with the quality of the software product
-
Project Metrics: These can be used to measure the efficiency of a project team or any testing tools being used by the team members
Another way to categorize metrics is by what it conveys.
-
Result Metrics: These metrics measure and gives output based on the results of an activity/process which is already completed.
-
Predictive Metrics: These metrics are derived based on other sources and they act as early warning signs of an unfavorable result.
What can we measure by using test metrics? Here are some of the things we can cover using test metrics.
-
To measure cost and time to test.
-
Overall status of bugs.
-
Count of fixed, reopened, closed, Deferred, bugs / measuring different statuses of bugs
-
Hidden bugs testing team couldn’t find.
-
Percentage and coverage of software testing
-
Whether the delivery timelines are achievable
We will look at some important metrics which can be used to measure process, product and project status at different phases in the software development and testing life cycles.
1. Requirements Coverage

As we all know requirements phase is a very important and having clear requirements matters to the overall quality of the final product. The quality of a finished piece of software is often defined by its ability to meet the requirements. Here what we look at is to monitor the effectiveness of the requirements. Requirement coverage looks at the cross section between the business requirements and actual workflows. Using workflows models can define stronger and more robust test coverage, with an emphasis on the workflows users actually follow. We can consider Requirements Coverage as a percentage of all the available flows against what is being covered by development teams.
2. Test Coverage

Defined as the extent to which testing covers the product’s complete functionality.
This metric is an indication of the completeness of the testing. It does not indicate anything about the effectiveness of the testing. This can be used as a criterion to stop testing. This does not need to be the lines of code. Coverage could be with respect to requirements, functional topic list, business flows, use cases, etc. It can be calculated based on the number of items that were covered vs. the total number of items.
3. Mean Time to Detect (MTTD)
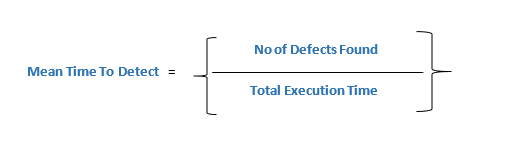
Mean Time to Detect gives a figure on how long does it take for QA professional to find a problem. Specially QA managers can use this to have some understanding about the efficiency and productivity of the QA team. Here No of Defects can be further taken as No of Valid defects found. There are some other matrices that can be used to calculate the validity of defects entered.
4. Defect Severity Index
-
We assign a number to each severity as : Critical(Sev 1)=8, High(Sev 2)=6, Medium(Sev 3)=3 , Low(Sev 4)=1
-
Then we multiply the number of issues in each category by the assigned number as:(No of Critical defects * 8) + (Number of High defects * 6)
-
Then we divide by the Total issue count
( (Num of Sev 1s * 8) + (Number of Sev 2s * 6) + (Number of Sev 3s *3) + (Number of Sev 4s * 1))/Total issue count
Weighted average index of the Severity of defects. A higher severity defect gets a higher weight. S1 is a show stopper, S2 is high severity, S3 is medium & S4 is low.
Ideally, this should slope down as test cycles progress. The weighted values used in the defect severity index can differ from organization to organization. Usually the defect severity index is sloping down as the testing cycle progress. This indicates an increasingly favorable trend. As the test cycle progresses severity index going down suggests increasing quality of the application (as lesser number of critical and high severity defects are being reported). If there is an improving trend in the defect severity index, it needs to be addressed immediately.
5. Defect Leakage
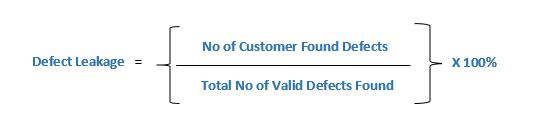
Defect Leakage is the percentage of defects actually leaked from the current testing phase to the subsequent phase. The total of defects identified in the later phase are taken as a percentage of valid defects entered in the previous phase. It can be used to identify the efficiency of the Quality Assurance (QA) testing. Defect leakage is a deadly one for the QA team. I.e. defect leakage percentage should be minimal in order to prove test team’s worth.
Above we discussed only few of the metrics that can be used track the quality. There are a lot of other QA/Testing metrics too that we can use to track the quality of the product and the work. Tracking the quality is not an easy task, but if we do so it will result in delivering more quality products which will eventually lead to the success of any organization.